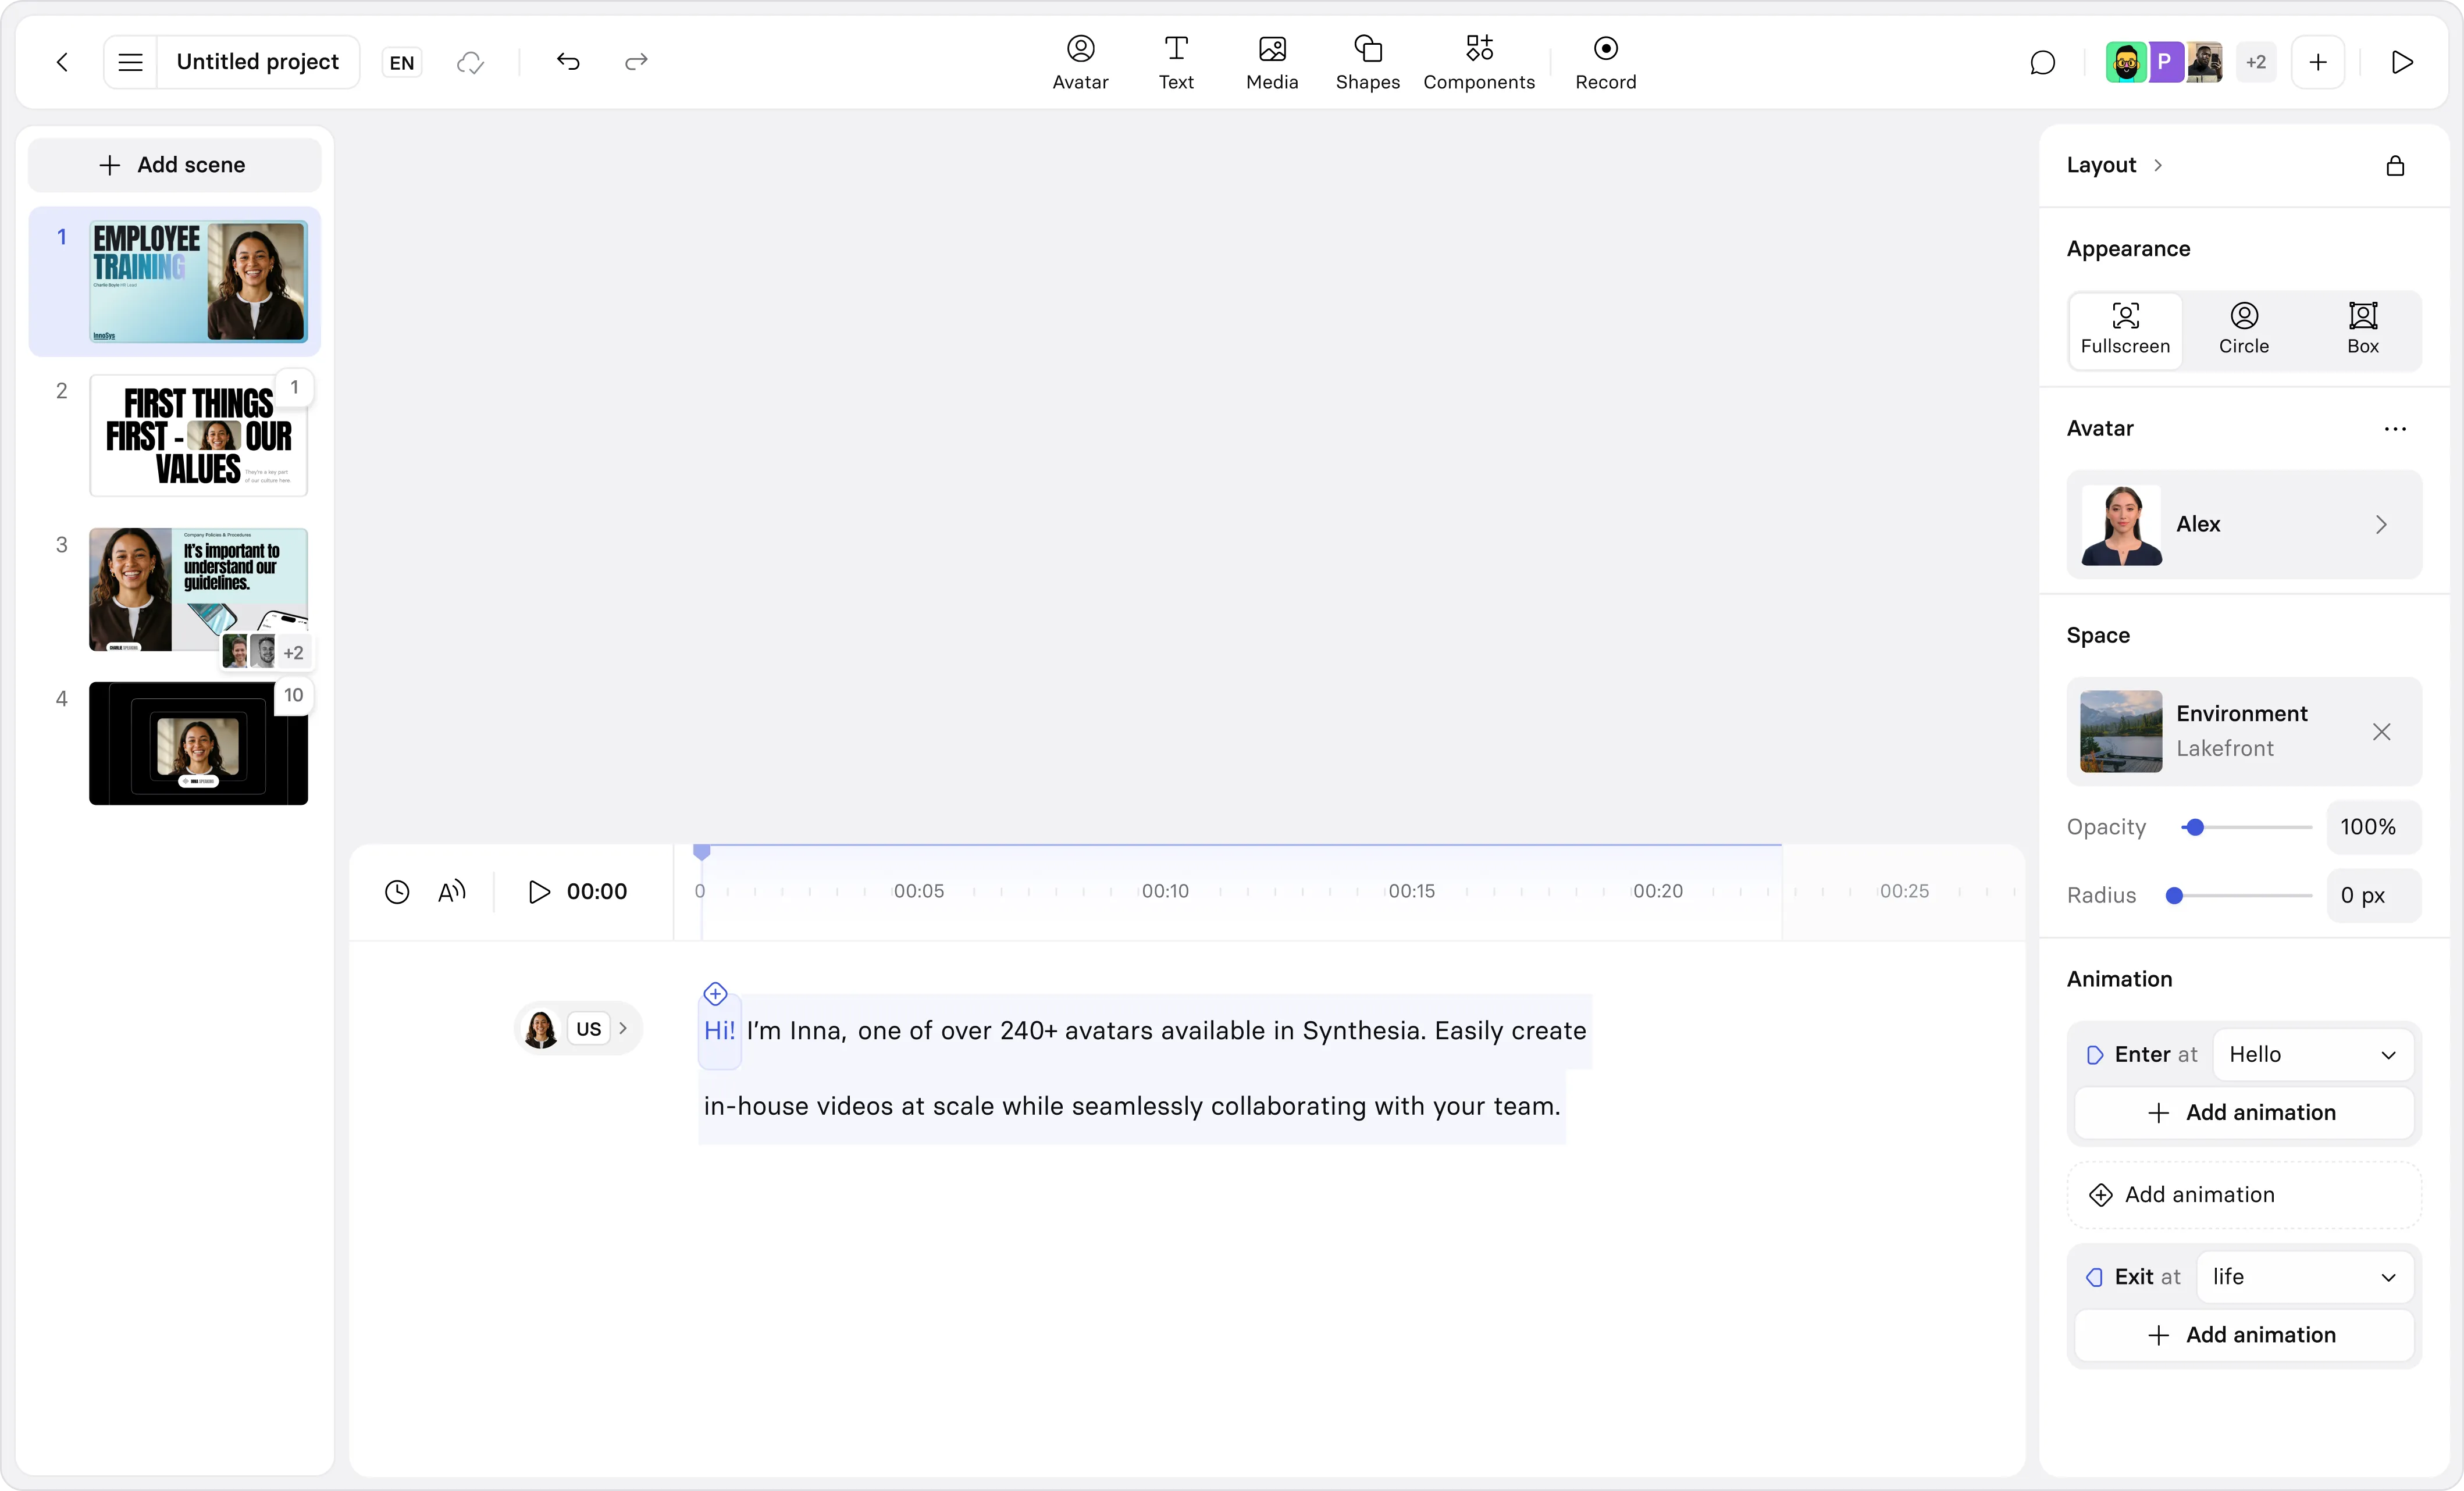
Easily browse, clone and customize Synthesia example videos.
An employee training video for new hire orientation at a municipal court. It provides an overview of Workwell, an HR information system where pay is processed, benefits are managed and onboarding tasks are documented.
An interactive training video about the GROW framework for structured coaching used by managers.
A product demo video for Orbit, a BI platform to get a straight answer from your business data.
A compliance training video covering safety training for Voltara Electric. This short orientation video is interactive, with a navigation menu for exploring different topics.
Build product knowledge and sales confidence for Techso Fiber conversations
A role-specific training video that shows client success teams how to guide a renewal conversation, uncover growth needs, and introduce a premium upsell naturally and consultatively.
Starting a new role should feel exciting - not overwhelming. NexConnect is NexWave’s internal employee portal, designed to help every new hire feel informed, connected, and ready from day one. This video showcases how the platform creates a smoother onboarding experience by giving employees a single place to access the tools, information, and updates they need most.
A professional training video example showing how to guide field technicians through a successful customer visit—from arrival and diagnosis to communication, documentation, and clean-up. Ideal for demonstrating onboarding, SOP training, and service excellence use cases.
A professional training video example designed for technical onboarding and product education. This sample walks viewers through equipment setup, hardware components, key features, and operational benefits using clear presenter-led instruction and supporting visuals.
A presenter-led internal training video showing employees how to use an AI support assistant to access help, check ticket status, and streamline everyday IT requests. Designed in a clear, modern instructional style with guided walkthroughs and practical examples.
A presenter-led corporate training video that teaches employees how to recognize modern phishing attacks, respond appropriately to suspicious emails, and reinforce key cybersecurity habits through a realistic quiz scenario.
A concise compliance training video that teaches employees how to create a safer, more ergonomic home workspace. It uses a practical scenario to highlight common posture, desk setup, and lighting issues, then guides viewers through simple adjustments that improve comfort, wellbeing, and long-term safety.
A polished sales enablement example that shows how to train teams on CRM dashboards, pipeline tracking, and performance reporting using a mix of avatar-led guidance and on-screen product visuals.
A polished product demo video showing how a customer-facing presenter can introduce NuviBot Premium, explain key features, and walk viewers through real business use cases like network monitoring, smart alerts, and instant reporting. Ideal as an example of a clear, benefits-led SaaS demo for marketing, sales, or product storytelling.
A professional compliance training video that explains why customer identity verification matters in anti-money laundering programs. It uses clear, scenario-based teaching to show how Customer Due Diligence helps prevent fraud, protect customers, and reduce regulatory risk.
A polished corporate training video example that shows how to teach information security and data privacy in a clear, engaging way. It combines presenter-led guidance, practical compliance principles, and a realistic workplace scenario to help employees understand secure data handling and suspicious request reporting.
An interactive healthcare training video that walks clinical staff through safe medication handling in a trial setting. This example combines scenario-based learning, step-by-step instruction, and knowledge checks to reinforce protocol compliance, patient safety, and accurate documentation.
A branching retail video experience that guides shoppers through a short series of questions to recommend the right chair based on their needs, style preferences, and budget. Designed as an engaging product discovery journey, it showcases how personalized video can boost interaction and move customers closer to purchase.
Answer five quick questions to learn how to build a balanced lunch and how healthy was your last meal.
An interactive finance video example that simulates a personalized savings and investment consultation. The presenter asks a series of questions about goals, time horizon, and risk tolerance, then recommends suitable financial plans such as growth, balanced, or tax-smart savings options.
Clickable interface hotspots let users explore each new feature, grasp the value fast and boost adoption.
Interactive video that lets drivers instantly fix odd noises, locked doors, or no-start issues on their own—no support call needed.
Click through realistic scam examples to learn how to identify and stop fraud.
Let employees click through a realistic emergency—so they remember exactly what to do when it counts.
Let doctors and sleep consultants explore cases, learn the latest standards and sharpen care—no more PDFs.
Watch a real customer exchange, then answer three questions to prove you can handle real situations on the floor.
Promotional video: Manage all your accounts in just one app
Customer support video: Learn how to read your bill
IT training: Learn the essential phishing protection tactics
Sales enablement: Learn what it means to value sell
Skill development: Learn how to communicate with your peers at work
Company Update: Learn about a new suite of tools to streamline your workflows
No results matches your search. Try refining your search term or see an example from the list below.
Try Synthesia with a free video.
Simply type in text and get a free video with an AI avatar in a few clicks. No signup or credit card required.