

Video Metrics: Which Matter and How to Track Them

Create AI videos with 240+ avatars in 160+ languages.
In this blog post I'm going to dive into which video metrics I think you should track, their limitations, and how to use them to get actionable insights that can help you to improve your videos.
What are video metrics?
When I say video metrics, I mean numbers that I track in order to get insights into how well my videos are performing.
There are 3 main types of video metrics:
- Quantitative metrics: These are number-based metrics that can give you quick insights into a specific aspect of your video. Some examples include view count, watch time, number of comments, number of likes, and number of shares.
- Qualitative metrics: This is non-numeric data that comes from viewer comments and other forms of direct viewer feedback like surveys.
- Conversion-related metrics: These show me how effectively my video is driving viewers toward taking my desired action. That action is normally something along the lines of clicking on a CTA, but it could also be creating an account or purchasing a product.
Tracking and analyzing these metrics will help you to understand the engagement that your video is getting and make better data-driven decisions with your videos, including how best to iterate on your videos, which video you should make next, and how to best maximize the ROI of your video strategy.
12 essential video metrics to track
Here's my list of the 12 most essential video metrics that you should be paying attention to.

Quick-start metrics if you're short on time
- Play rates: The number of people who see your video and actually play it.
- Completion rates: The percentage of viewers who watch through to the end.
- Clicks and click-through rates: How many viewers follow your CTA and click on your link.
Tracking these three metrics gives you an instant snapshot of video performance.
Metric 1: Video plays
Video plays count how many times a video was played, meaning a viewer hit the play button.
Track this video metric to measure:
- Topic attractiveness: People can hit play on video content because they're interested in the topic.
- Video marketing effectiveness: People clicked play because of the video's thumbnail, title, or on-page placement.
However, video plays does not give you any insights into the level of engagement of your viewers, like how long they watched for.
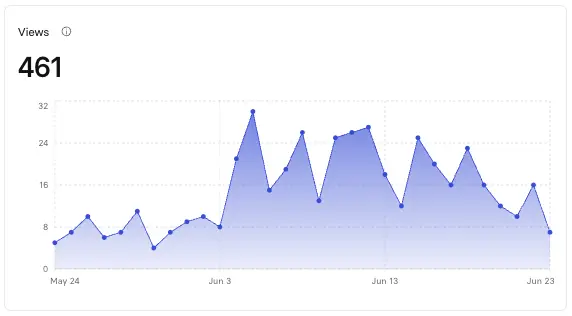
Metric 2: View count
View count is a very similar metric to video plays in that it also counts the total number of times a video was played.
However, the distinction is in how "played" is defined, with different social and video platforms setting different minimum view time thresholds.
For example, a view on Facebook is only counted if the viewer watches for a minimum of 3 seconds, while on YouTube a view is only counted if the viewer watches for at least 30 seconds.
Some of these platforms also distinguish between total views and unique views (which excludes the same people rewatching a video).
I find both video plays and view count to be vanity metrics. They are foundational metrics that you need to monitor, but in isolation they really don't tell you about how well your video content is performing.
Metric 3: Impressions
Impressions measures the number of times your video was displayed to potential viewers, regardless of whether they clicked play or not.
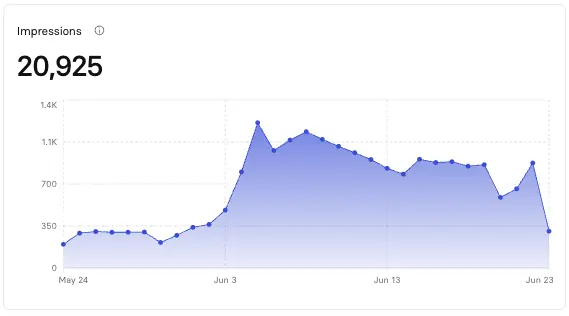
It's a metric that tells you about the potential reach of your video and how effective your distribution is, or in other words how well your video is being surfaced across the different platforms or pages it exists on.
Impressions is also a key component in the next metric, view rate.
Metric 4: View rate
A video's view rate is the percentage of impressions that resulted in a view.
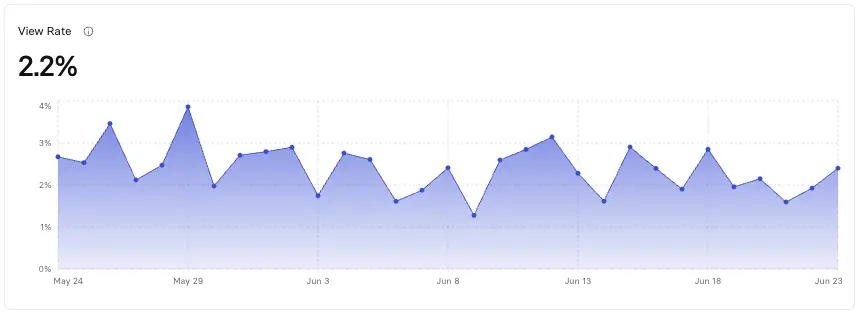
To calculate it you need to divide your views by your impressions and then multiply by 100.
High impressions but low views will result in a low view rate, which typically means that your thumbnail, title, or video placement might need optimization. It's a metric that tells you whether your video packaging is compelling enough to convert browsers into viewers.
View rates can also give you insights into the content-market fit of your video.
If you have a low view rate but you're happy with your video packaging, it might just be that your video is getting exposed to the wrong audience, or that your video topic doesn't resonate.
It's hard to say what a good view rate is, but generally I'd say around 15% is considered good.
Metric 5: Play rate
Play rate measures the percentage of visitors who play a video on a web page out of those who have viewed the page. It's calculated by dividing the video's number of plays by the web page's number of impressions (or views).
For example, if your web page has 30,000 unique visits, and your video view count is 3,000, then you'll have (3,000 / 30,000) * 100 = 10% play rate for that web page.
This metric can give you an idea of how well placed your video is on your web page, with videos at the top of a web page typically having a higher play rate than those buried at the bottom.
It's not just about placement though — it's also a reflection of your video packaging and your content-market fit.
Metric 6: Watch time
Watch time calculates the amount of time viewers have spent watching a video.
This metric typically comes in two flavors:
- Total watch time: This is the cumulative time spent watching your video by all viewers
- Average watch time: This is the average time spent watching your video across all viewers
For example, if your video is 90 seconds long and is watched about half of the way through (40 seconds) by 3,000 people, then that would give you a total watch time of 33 hours and 20 minutes, and an average watch time of 40 seconds.
Watch time is a metric that gives you insights into how much viewers are engaging with your video.
That makes it different from all the metrics we've looked at so far in that it actually tells you if your viewers enjoyed what they were seeing.
It's also a metric that can help you improve your content. If your average watch time is 40 seconds, why is that? What happens at 40 seconds? Why are your viewers switching off at that point?
Similarly, if you make a change to your video and the average watch time goes up, it might have been a beneficial improvement that you can iterate on.
While watch time doesn't give you a read on viewer satisfaction (that comes from other metrics such as likes, comments, shares, and completion rates), it is highly correlated, since if a user isn't enjoying the video they will typically switch off.
Metric 7: Completion rate
The completion rate shows the percentage of viewers who watched a video from start to finish.
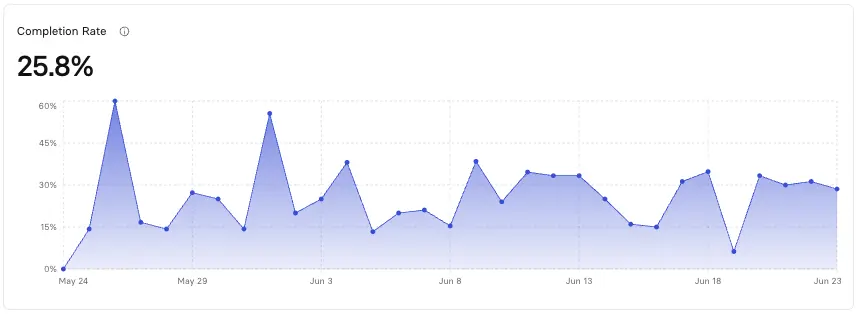
You can calculate it by dividing the number of complete views (which is the number of times a viewer watches the entire video) by the total number of plays and then multiplying that number by 100.
For example, if your video is played 500 times and of those 500 plays, 100 viewers watched all of your video, that would give you a completion rate of (100/500) * 100 = 20%.
The completion rate is another example of an engagement metric, and it can give you insights into how continuously interesting your video is to your audience.
If you make a change to your video and the completion rate goes up, it was probably a good change.
Conversely, if your completion rate goes down after a change, you should look to see if you perhaps damaged the flow of your video or changed a section that was resonating with your audience.
You should also bear in mind that completion rates can vary significantly depending on the context your video is in.
You might aim for a completion rate for a training video of 60% or higher, whereas a completion rate of 20% for a social media video might be exceptional.
Metric 8: Engagement curve (drop-off analysis)
The engagement curve is a visual graph showing viewer retention at each point in your video.
It's best explained by showing you, so here's the engagement curve for a video I have on one of my blog posts.

You can see that my engagement rate is 42.2%, which is the average percentage of my video that was watched by my viewers.
You'll notice that my engagement curve shows a pretty smooth decline as the video progresses.
This is very normal and pretty much what you want to see — I can't spot any obvious drop-off points where users get bored.
This is one of my favorite video metrics, as it can reveal exactly where viewers lose interest and help you pinpoint confusing sections (sudden drops) or highly engaging moments.
It can also give you a really clear view of whether your hook (the opening introduction of your video) is effectively capturing your audience's attention in the first 10 seconds or so.
All of these insights are not only great for reworking and reoptimizing your existing videos, but also for giving you direction when planning new video content.
Metric 9: Clicks and click-through rates
Clicks are the number of times viewers have clicked on a link or call-to-action (CTA) within or associated with a video. The click-through rate (CTR) is the percentage of clicks to landing pages from the number of times the video (or the CTA within the video) was shown.
For example, if you have a video ad with an embedded CTA like "Sign Up Now" and the video is viewed 1,000 times, but only 50 viewers click on the video CTA, the CTR will be 5%. It's calculated as (50 / 1000) * 100 = 5%, meaning that 5% of the viewers who watched the video clicked on the CTA.
What does your CTR tell you? Well, a lot of different things.
It can tell you how effective your CTA is in terms of its design, its copy, and its placement, and it can also tell you how relevant and appealing the offer is to your video audience.
Remember that poorly designed or misplaced CTAs can result in a low click-through rate, regardless of the video quality.
A CTR is also a key metric for assessing the ROI of your video strategy, as it can tell you how effective your videos are in converting viewers into leads and customers.
If you're interested in adding clickable elements like hotspots and CTAs to your video, you can find out how to do it in Synthesia in this video.

Metric 10: Social shares
Social shares count the number of times viewers across social media platforms have shared a video.
Whether your video campaigns are on Facebook, Twitter, Instagram, or wherever you share videos, especially if you're using the same content, it's a good idea to separate view counts by platform as you track metrics.
This approach will give you even more valuable information about what platform works best for what type of embedded videos.
Social shares are a metric that indicates deep engagement with your video, which is far more valuable than views.
It's something that only really happens when your video's content is really resonating with your audience.
Social sharing is context-sensitive. No matter how appreciated internally, a video designed to train employees on handling sensitive customer data won't make it on external platforms because of the content's nature and the company's policies on sensitive content and confidentiality.
You should always try to focus on shareability metrics that make sense for your video's purpose and audience.
Metric 11: Video ROI (Return on Investment)
The video ROI is the percentage of cost vs. income generated from the video. It's calculated by subtracting the cost of the video production and promotion from the revenue generated by the video, dividing this by the cost, and multiplying by 100.
At its most basic level, if it costs you $5,000 to produce and promote a specific video, like a product demo, and, as a result of that video marketing campaign, your sales amount to $15,000, the direct ROI for this particular video is 200%. It's calculated as [(15,000 - 5,000) / 5,000] * 100 = 200%, meaning that for every dollar you spend on the video, you earn back two dollars in revenue.
Track this video metric to measure:
- Financial effectiveness: Shows how well your video's doing, money-wise.
- Strategic planning: Helps you map out long-term video marketing game plans.
ROI for videos quantifies direct and indirect revenue generated within a time frame. Remember, ROI calculations typically don't account for benefits like brand building, audience engagement, or customer education, which can indirectly contribute to long-term profitability.
Pro tip: Track video ROI over time
Track video ROI over 90+ days, not just immediately. Videos often continue generating value long after publication. Review periodically to understand true long-term impact and develop an average estimate of how long a video might generate revenue.
5 ways to improve your video metrics
Now that you're tracking the right metrics, let's talk optimization.
These data-driven tactics will help boost your video engagement metrics and overall performance.
1. Optimize thumbnails and titles
Be sure to A/B test different thumbnail and title variations, and try to use clear and benefit-driven copy that promises value and explains the benefits to your viewer.
Your thumbnail is the first impression that a potential viewer will have of your video, so you need to make it count by using compelling visuals and enticing (and readable) copy.
2. Hook viewers in the first 10 seconds
Remember when we looked at engagement curves?
The first 10 seconds of your video are critically important for your video's performance as that's where viewers tend to drop, so that's when you need to hook them in.
You need to start your video with your most compelling content and tease what's coming in the rest of your video. I usually try to ask a provocative question to grab my viewers' attention.
3. Add captions and interactive elements
Most viewers watch videos without sound, so adding captions is always a good idea and can really boost your video performance without much effort.
Adding interactive features like clickable CTAs and quizzes can boost your video engagement too, so try to use them where you think it's appropriate.
4. Right-size video length for platform and purpose
Combine your knowledge of your audience with hard data like average watch times and completion rates to zero in on your optimal video length.
While social media videos tend to be on the shorter side (around 2-3 minutes max), you might be able to justify your content running for much longer.
5. Test placement and distribution
If your video is above the fold, it'll most likely get more impressions and a higher play rate, but higher up the page also means your potential viewers have less context which might make them quicker to drop, so there's always a trade-off.
You should always be experimenting with different video placements and tracking which contexts drive the best performance as measured by your key metrics.
Kyle Odefey is a London-based filmmaker and Video Producer at Synthesia. His content has reached millions across TikTok, LinkedIn, and YouTube, even inspiring an SNL sketch, and has been featured by CNBC, BBC, Forbes, and MIT Technology Review.
Frequently asked questions
What are video metrics?
Video metrics are numbers that you can track in order to get insights into how well your videos are performing. Tracking and analyzing these metrics will help you to understand the engagement that your video is getting and make better data-driven decisions with your videos, including how best to iterate on your videos, which video you should make next, and how to best maximize the ROI of your video strategy.
How can I improve my video metrics?
I recommend trying to optimize your video thumbnails and titles, improving your video's hook (the first 10 seconds) to capture viewer attention, adding captions (always) and interactive elements like CTAs and quizzes (sometimes), right-sizing your video's length to fit the audience and platform that it's targeting, and testing video placement as much as possible.