

The L&D Budget Guide

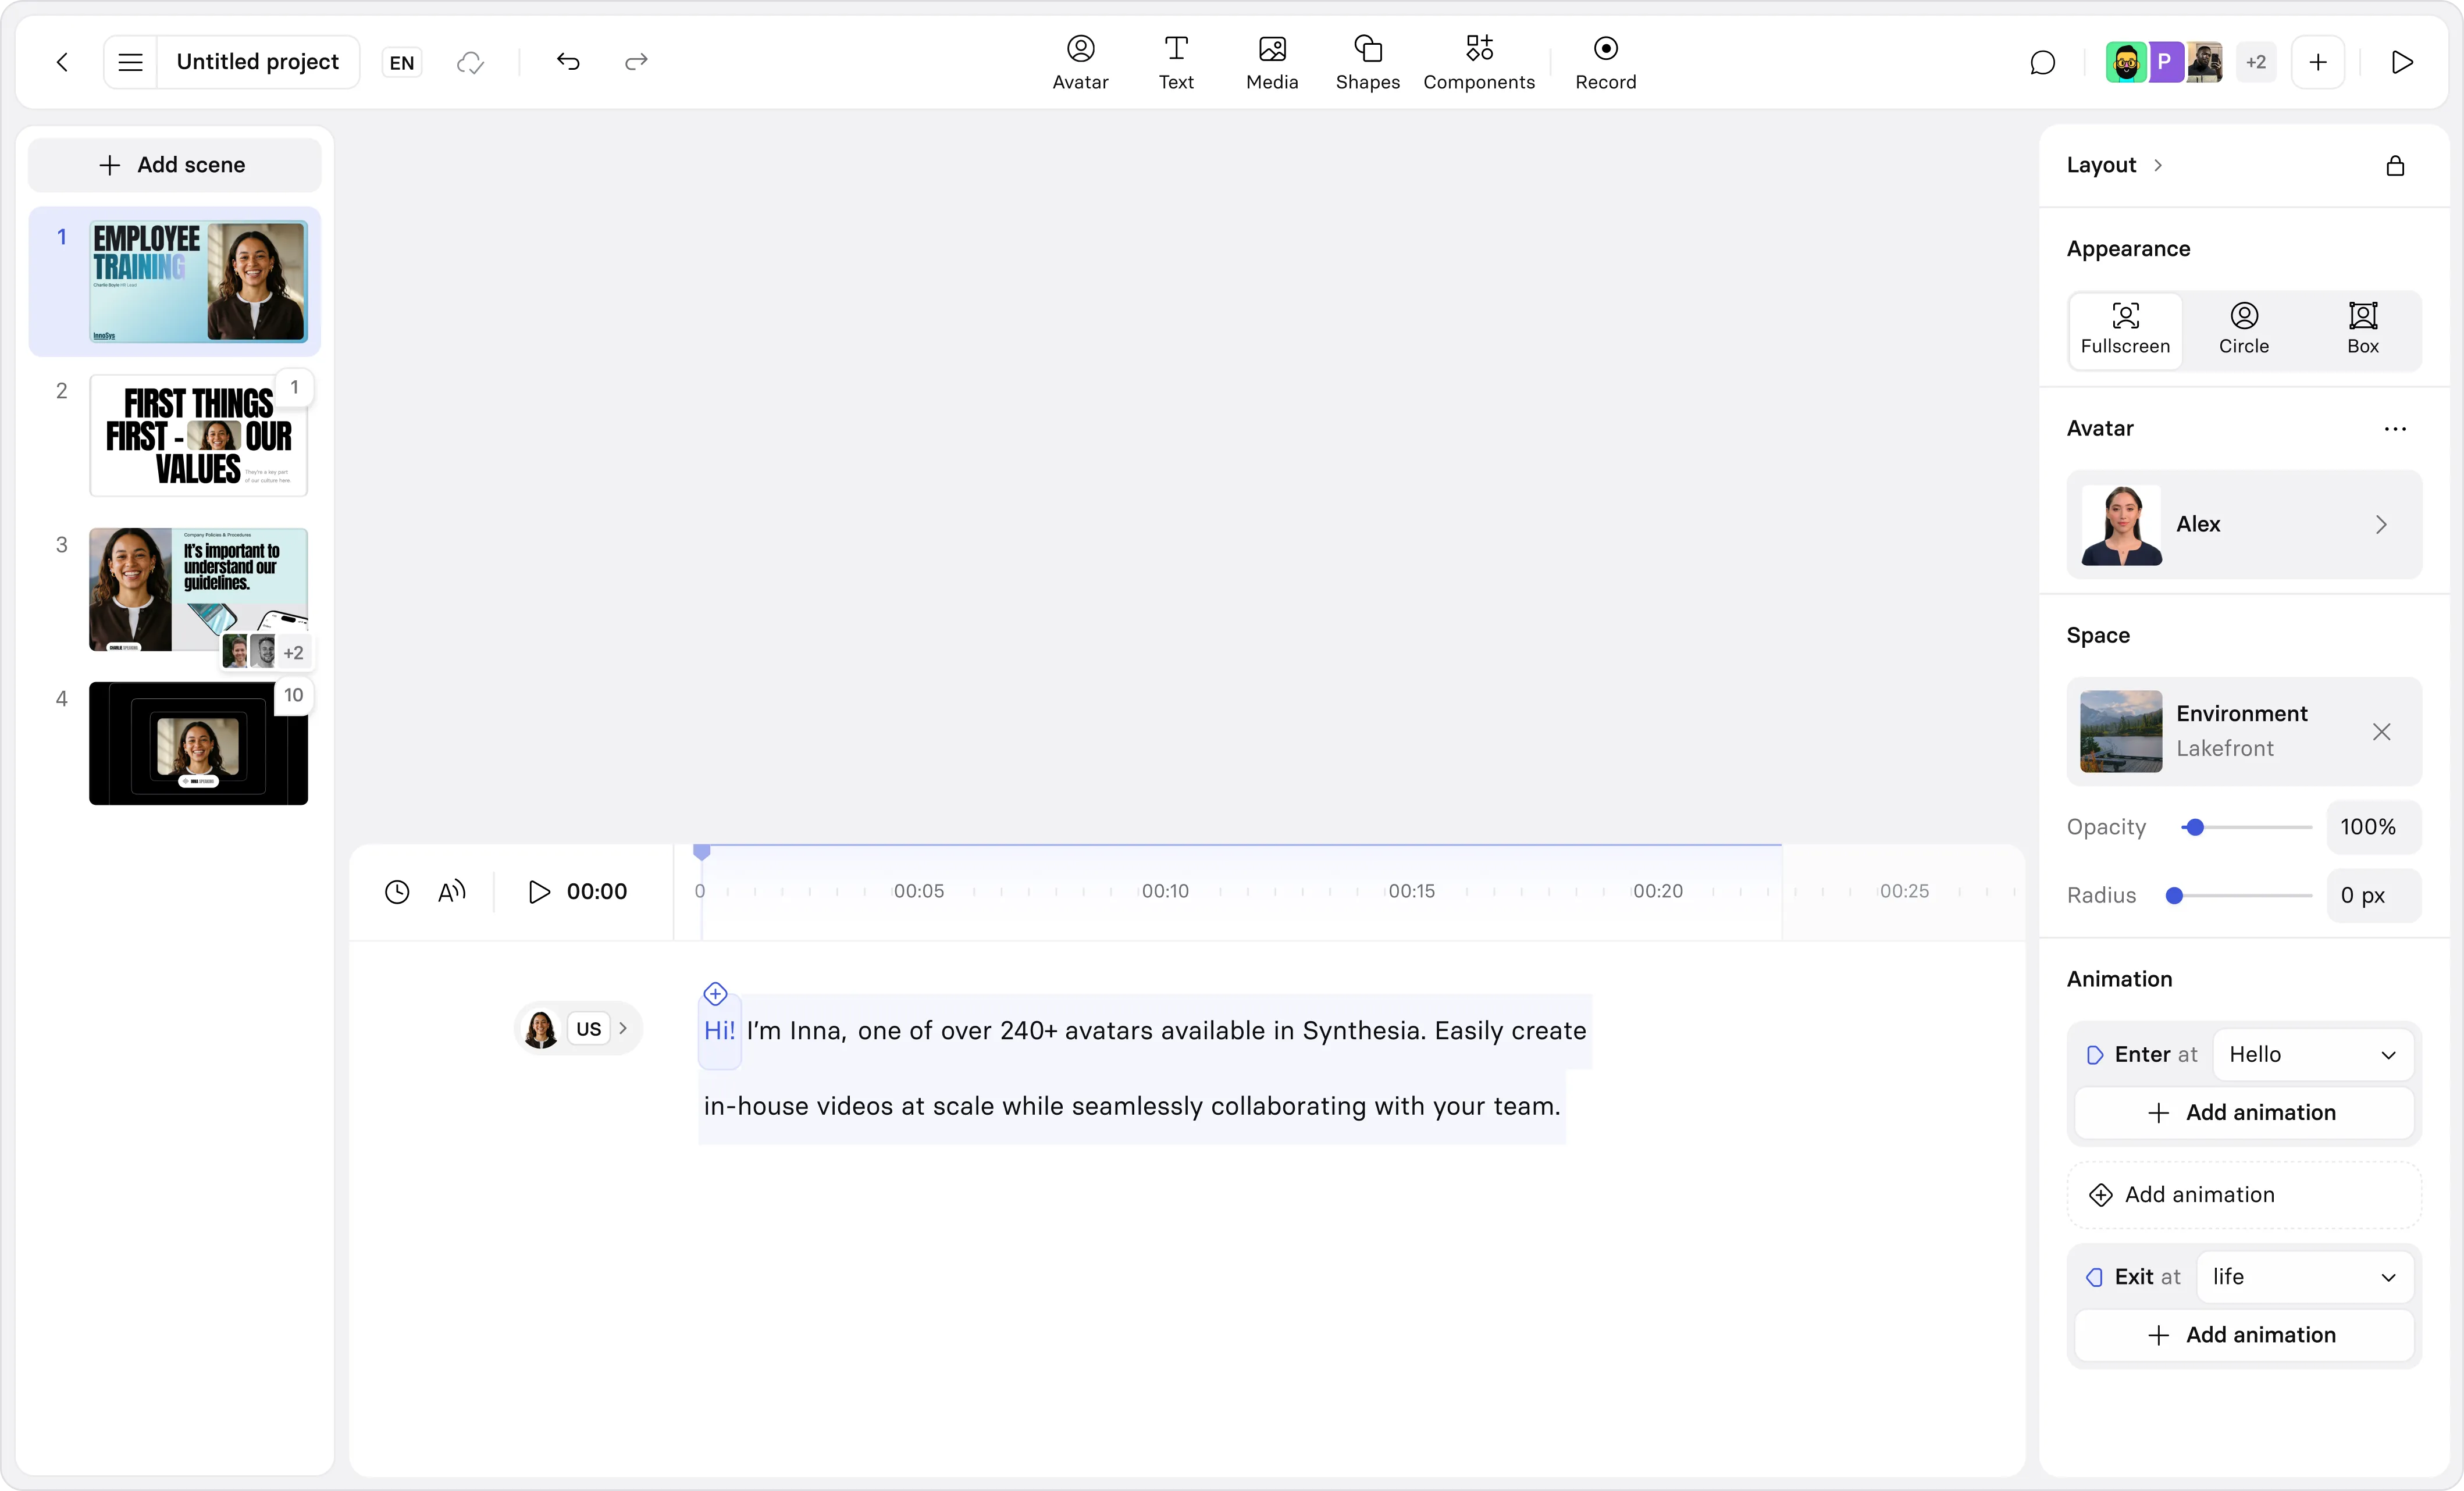
Create engaging training videos in 160+ languages.
L&D is often considered a cost center, meaning it incurs expenses, and doesn’t directly generate revenue.
And unfortunately, it means L&D is evaluated on imperfect metrics like the cost per learner or training hours per employee, which can be especially challenging as the cost per learner is rising, and the number of formal training hours per employee is falling.
Whether you’re building an L&D budget for the upcoming year or for the first time, you need to align your strategy, and consequently budget design, to the business. That starts by articulating clearer evaluation metrics that your Finance team can get behind.
Partnering with Finance
Before you do anything else, find out who your Finance partners are. It’s always worth double-checking in case there's been any team changes. Also, confirm if there are any other members of your team involved in the planning process, such as more senior leaders.
Oftentimes, your Finance partner will host a kickoff meeting for the upcoming FY planning process. But I find it easier to prepare for these meetings if I understand the company’s planning approach.
Depending on my familiarity with the organization, here are the questions I would come with to a meeting.
For those experienced with budgeting at the organization:
- What's the planning cycle for the upcoming fiscal year (FY)? When are budgets confirmed? Do we reforecast at all?
- Any changes to how you want L&D spend categorized and reported?
- Any changes to how different types of costs, such as headcount or travel and expenses (T&E), are classified and approved?
- Any changes to how we request additional funds?
- And most importantly, what's our definition of success? Can we align on evaluation metrics for our budget?
For those new to budgeting at the organization:
All of the above, plus:
- How are budgets allocated? Are they top-down or bottoms-up?
- How is L&D spend categorized and reported?
- How are different types of costs, such as headcount or T&E, classified and approved?
- Do teams have access to any development funds? If so, how much and do I have any visibility into that spend?
- Do individuals have any professional development budgets or stipends? If so, how much and do I have any visibility into that spend?
- How do we request additional funds?
Whatever you do, please write down the answers to these questions, preferably in a shared document that you can send as a follow up email. That way, you have a paper trail of alignment that you can return to if you get pushback.
I once had a Finance partner leave mid-FY, and spent too much time rehashing how decisions were made, such as why we covered T&E for participants in certain programs and not others.
Note: The biggest mistake I see when someone is putting together an L&D budget for the first time is underestimating costs for content maintenance and delivery. Plan for changes, whether that’s updating content or expanding the delivery of a program to a new audience.
Choosing your budgeting model
Every year, it’s worth evaluating how you organize and allocate your L&D budget.
I’ve found that most L&D teams budget using a blend of two or more of the following models, so that they can have predictable funding for flagship initiatives (things like onboarding) while retaining the flexibility to adapt to the business.
If you're wondering what it looks like to blend together budgeting models, here are a few common pairings that I've seen.
Note: Professional development funds can be a sticky subject for L&D. In some organizations, they are offered as a stipend or budget, and L&D is given no visibility into how they’re used (unless you beg many, many times). In other organizations, L&D is responsible for approving individual expenses.
No matter where your organization falls, and whether or not you have any say in that decision, I recommend pushing for a clear policy that outlines best practices for the funds.
Applying your model
After you’ve aligned on the model(s) that make the most sense for your organization with Finance and your leadership team, you can start building your budget.
I like to think about this process like building a house (not that I’ve ever done that). The models you’ve chosen are your blueprint. They help you plan what you’re going to do and why, so that the budget is structurally sound.
Now you need to frame out your budget. And the goal here is consistency. If you were framing out a house, you wouldn’t want to use lumber when the drawings called for metal.
Finance should be able to review your budget and know what everything is (this is where that documentation comes in handy). This also makes it easier to compare spend year-over-year, and more importantly to evaluate impact. So when you’re framing your budget, pick consistent labels to categorize spend.
Note: Executive coaching (or any executive development) can blow up a budget. Whatever you do, do not lump together executive development with anything else. It's its own line item.
The headcount problem
Perhaps the biggest variance I see in L&D budgets comes down to headcount, which is really an issue of capacity. L&D teams often have the least flexibility when it comes to adding someone to their team. As a cost center, there are additional hoops to jump through to demonstrate to Finance the necessity of that hire.
Of course, if you were hoping to hire an instructional designer, but don't get the headcount approval, your budget may expand in other directions that Finance will accept. That may include a third-party for content creation or the procurement of an AI tool for learning design. Or leaders accepting something getting deprioritized.
When making those tradeoffs, consider: what do we need to be consistently available (whether for creation or delivery), and where do we have flexibility?
It may be easier to get budget support for onboarding and compliance than a one-off workshop for an engineering team.
Just be sure to factor in capacity for accommodating the business. We all know it's one thing to keep business as usual running for L&D, but another entirely to build a net new program aimed at transformation.
Evaluating your budget
Excuse me for a moment as I pull out my soapbox.
If you've been around for a while, you've likely heard me say that we need to prioritize measurement in everything we do, from designing our roadmap to assessing our tech stack, and yes, even making our budget.
Earlier, I said that in your conversation with Finance, you needed to align on evaluation metrics. That's because you need to know what they care about and how they report back to the business. More importantly, you want to build a partnership with Finance where they understand the work they're investing in, and why.
The best way to do this is to align expectations, and learn how to tell the story with the data you capture. What you care about and what Finance cares about may not be the same thing. But I guarantee you Finance cares that they can see a credible connection from a learning experience to business outcomes, like KPIs.
And most likely, they have a preference for how that gets reported out (ahem, spreadsheets). So use your educational powers to help them understand not just what you're spending, but why. Be honest when something isn't working, but also highlight transformational moments. You might be surprised to find your newest ally.
(Steps off soapbox.)
Note: I go into a deeper dive on how to calculate "good enough" ROI in this post, but high-visibility (aka expensive programs) benefit from a more robust calculation method, like the Phillips ROI methodology below.
Amy Vidor, PhD is a Learning & Development Evangelist at Synthesia, where she researches learning trends and helps organizations apply AI at scale. With 15 years of experience, she has advised companies, governments, and universities on skills.
Frequently asked questions
What should be included in an L&D budget?
How much should you budget per employee for learning and development?
What are the most common L&D budget models?
What’s the difference between an L&D budget and an L&D cost center?
How do you calculate the true cost of a training program?
When should you use the Phillips ROI method for L&D?
How do you justify an L&D budget to Finance?
Align on evaluation metrics early, ideally in your first Finance conversation of the planning cycle. Use consistent cost categories so spend is comparable year over year. Connect priority programs to outcomes Finance already tracks. And be honest. Finance will trust a partner who flags problems early far more than one who surfaces them late.