AI in Learning & Development Report 2027
See how L&D teams are adopting AI, and what’s standing in the way of measuring its impact. Based on input from 831 professionals in over 25 countries.

AI delivered speed. Personalization is still ahead.
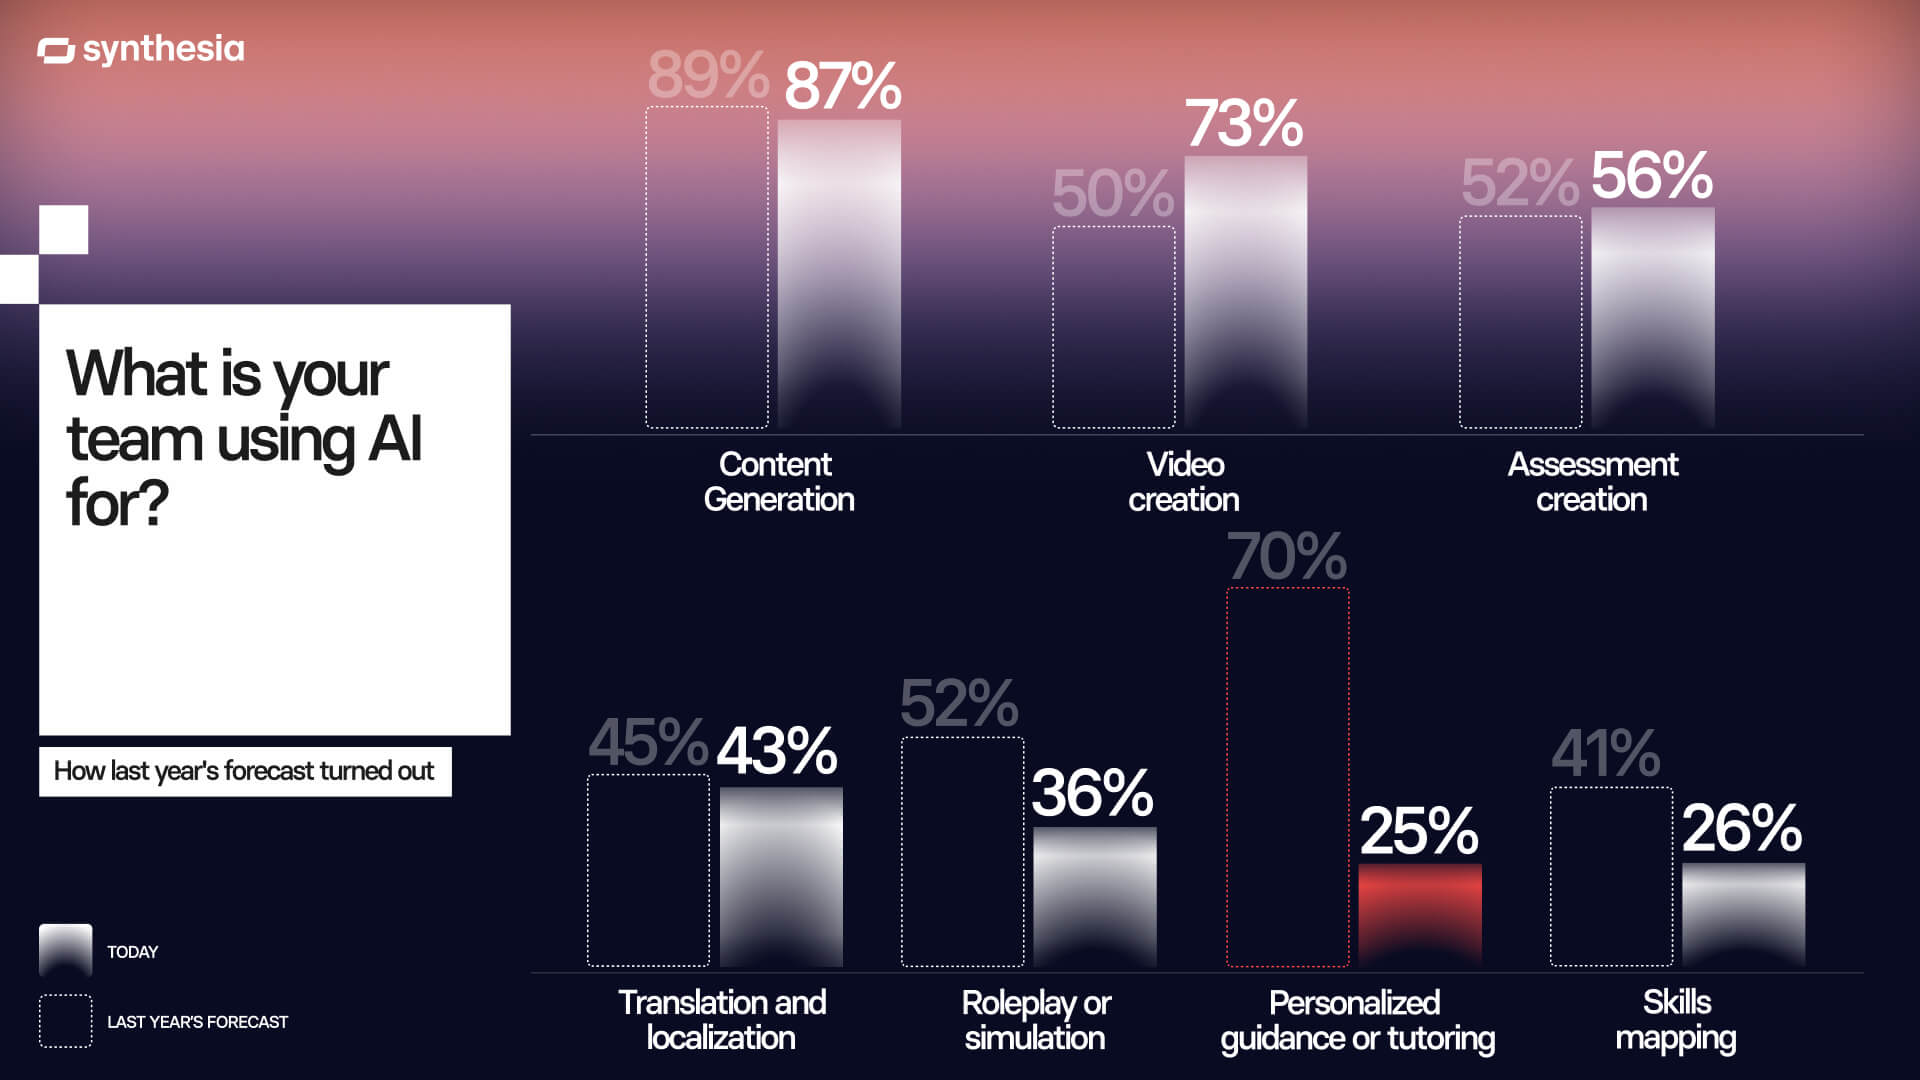
Respondents who use AI. Forecast = using or planning to use within 12 to 18 months, last year (n=391). Today = using (n=802). pts = percentage points. Question wording changed from last year, so read as direction. Source: Synthesia AI in L&D Survey 2027 and 2026.
L&D practitioners expected to be able to do more with AI by now.
This is our third year surveying L&D practitioners about the role of AI in learning and development. What we have found is that AI primarily, and consistently, delivers value by speeding up content production. Where practitioners had anticipated AI would deliver more value is in personalized learning, but most teams aren’t there yet.
If you’re in L&D, neither finding will likely surprise you. What’s less obvious is why the gap persists.
One explanation is that organizations optimize toward the known at the expense of the unknown. In organizational learning research, this pattern is referred to as exploitation versus exploration. Exploitation is getting better at what you already do. Exploration is trying out things that you don’t do yet.
This pattern is behind much of the guidance around AI adoption for organizations. That’s why organizations start by applying AI to existing workflows. It is easy to isolate one workflow and apply AI. You get quick results and can easily iterate with feedback. In L&D, this might look like using an LLM to support your needs analysis by having it draft questions or summarizing stakeholder interviews.
How your L&D team uses AI often reflects what your organization rewards and permits. If your team is assessed on the volume of training content produced, then it makes sense that you’re using AI to produce content. The incentives point toward the known, so that’s where the AI adoption goes.
The result is that your team keeps optimizing what it already does instead of experimenting with what might be possible with AI.
If your L&D team wants to evolve how it uses AI, the survey points to three things that make results beyond volume visible: better performance data, visibility into AI spend, and alignment on success metrics for those experiments. Spend visibility is the clearest example. Without it, you can’t tell where AI makes sense to use. Pricing is changing and AI is a steep investment, so you need to understand how each AI tool affects cost per learner for a given learning experience.
With those three things in place, you can experiment with using AI to deliver more personalized learning experiences, and measure whether it is changing on-the-job performance and business outcomes.
Key Takeaways
Six findings from our AI in L&D survey help explain why.

37% of respondents say AI is widely adopted across their work, while 24% are still exploring or piloting it.

73% of respondents whose teams started from a mandate need sign-off before piloting a new AI tool, compared with 57% of those who started from the bottom up.

59% of respondents name cost and value among their most important factors when choosing an AI tool, and budget is the second-biggest barrier to using AI.

56% of respondents expect AI-related L&D spend to rise over the next 12 months, and 45% of those who aren’t sure what they spend today expect the same.

40% of respondents who use AI at the evaluation stage consistently measure on-the-job performance, compared with 72% who measure participation.

75% of respondents name faster content creation as one of the clearest impacts they’ve seen from AI, and only 11% name improved on-the-job performance.
Adoption

What separates L&D teams is how deeply AI is integrated into their workflows.
73% of respondents use AI in specific workflows (36%) or widely across their work (37%). Respondents in technology were the most likely to report widespread adoption (55%), and those working in more regulated industries like healthcare, manufacturing, and energy and utilities were among the least likely (27% combined).
“AI transformed my L&D work from delivering training courses to designing AI-enabled learning ecosystems. L&D is no longer just about training people; it is about improving how the organisation knows what it knows with knowledge and AI.”
- A learning professional at an enterprise retail company
2% of respondents said they were not using AI, and 1% indicated that AI adoption had stalled. Of the 12 respondents whose adoption had stalled, 6 cited quality problems and 5 cited approval delays as factors leading to this stagnation. Other issues cited included resistance to AI and missing capabilities.
Use Cases
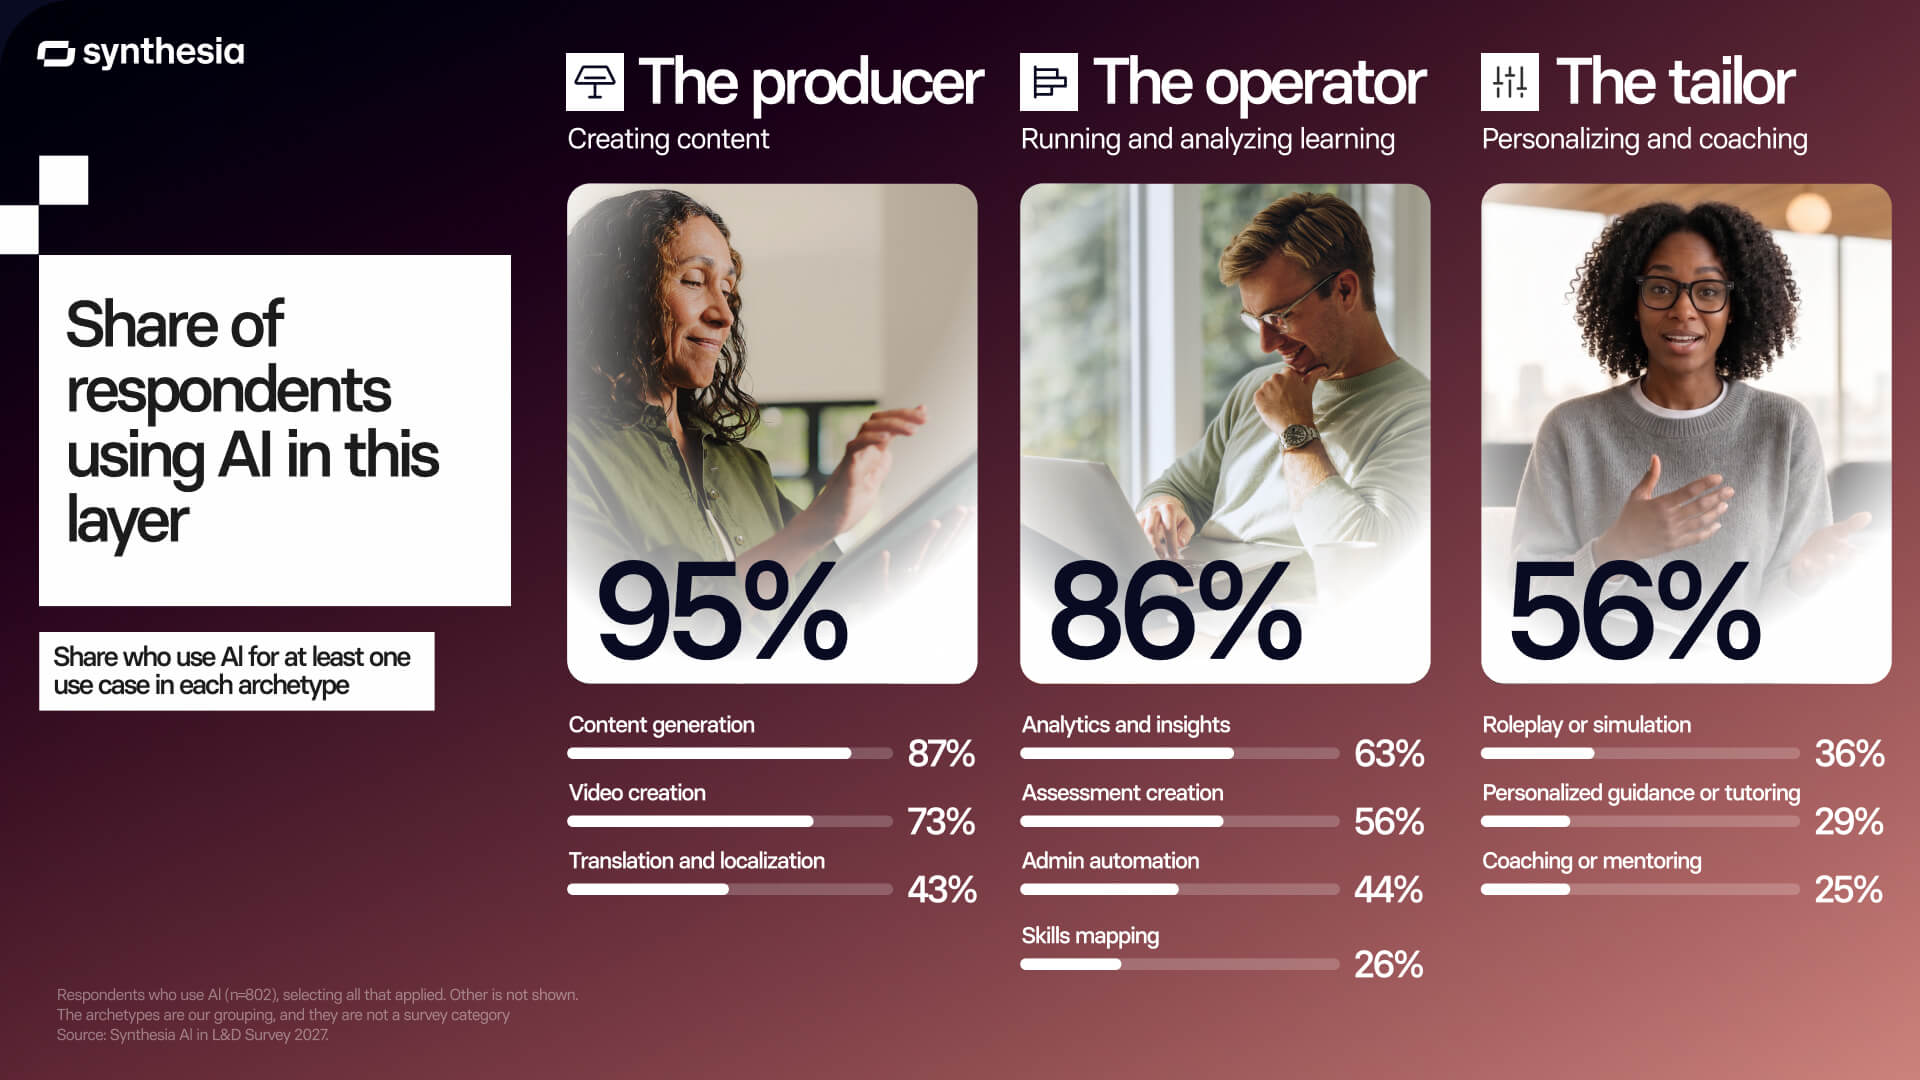
There’s more than one way to group these use cases. We’ve organized them into three archetypes of AI work: the producer, the operator, and the tailor.
The percentage under each archetype is the share of respondents who use AI for at least one of its use cases (many use all three). Nearly every L&D team is using AI as a producer, and a large majority are using it as an operator. Meanwhile, just over half are using AI as a tailor of learning experiences. The teams furthest along are far more likely to use AI as a tailor: 67% of respondents who describe their AI use as widely adopted do, against 44% of those still exploring.
Among respondents who use AI, more than half use it for 5 or more of the 10 use cases we listed. Content generation (87%) remains the main use case, followed by video creation (73%), analytics and insights (63%), and assessment creation (56%).
Approvals
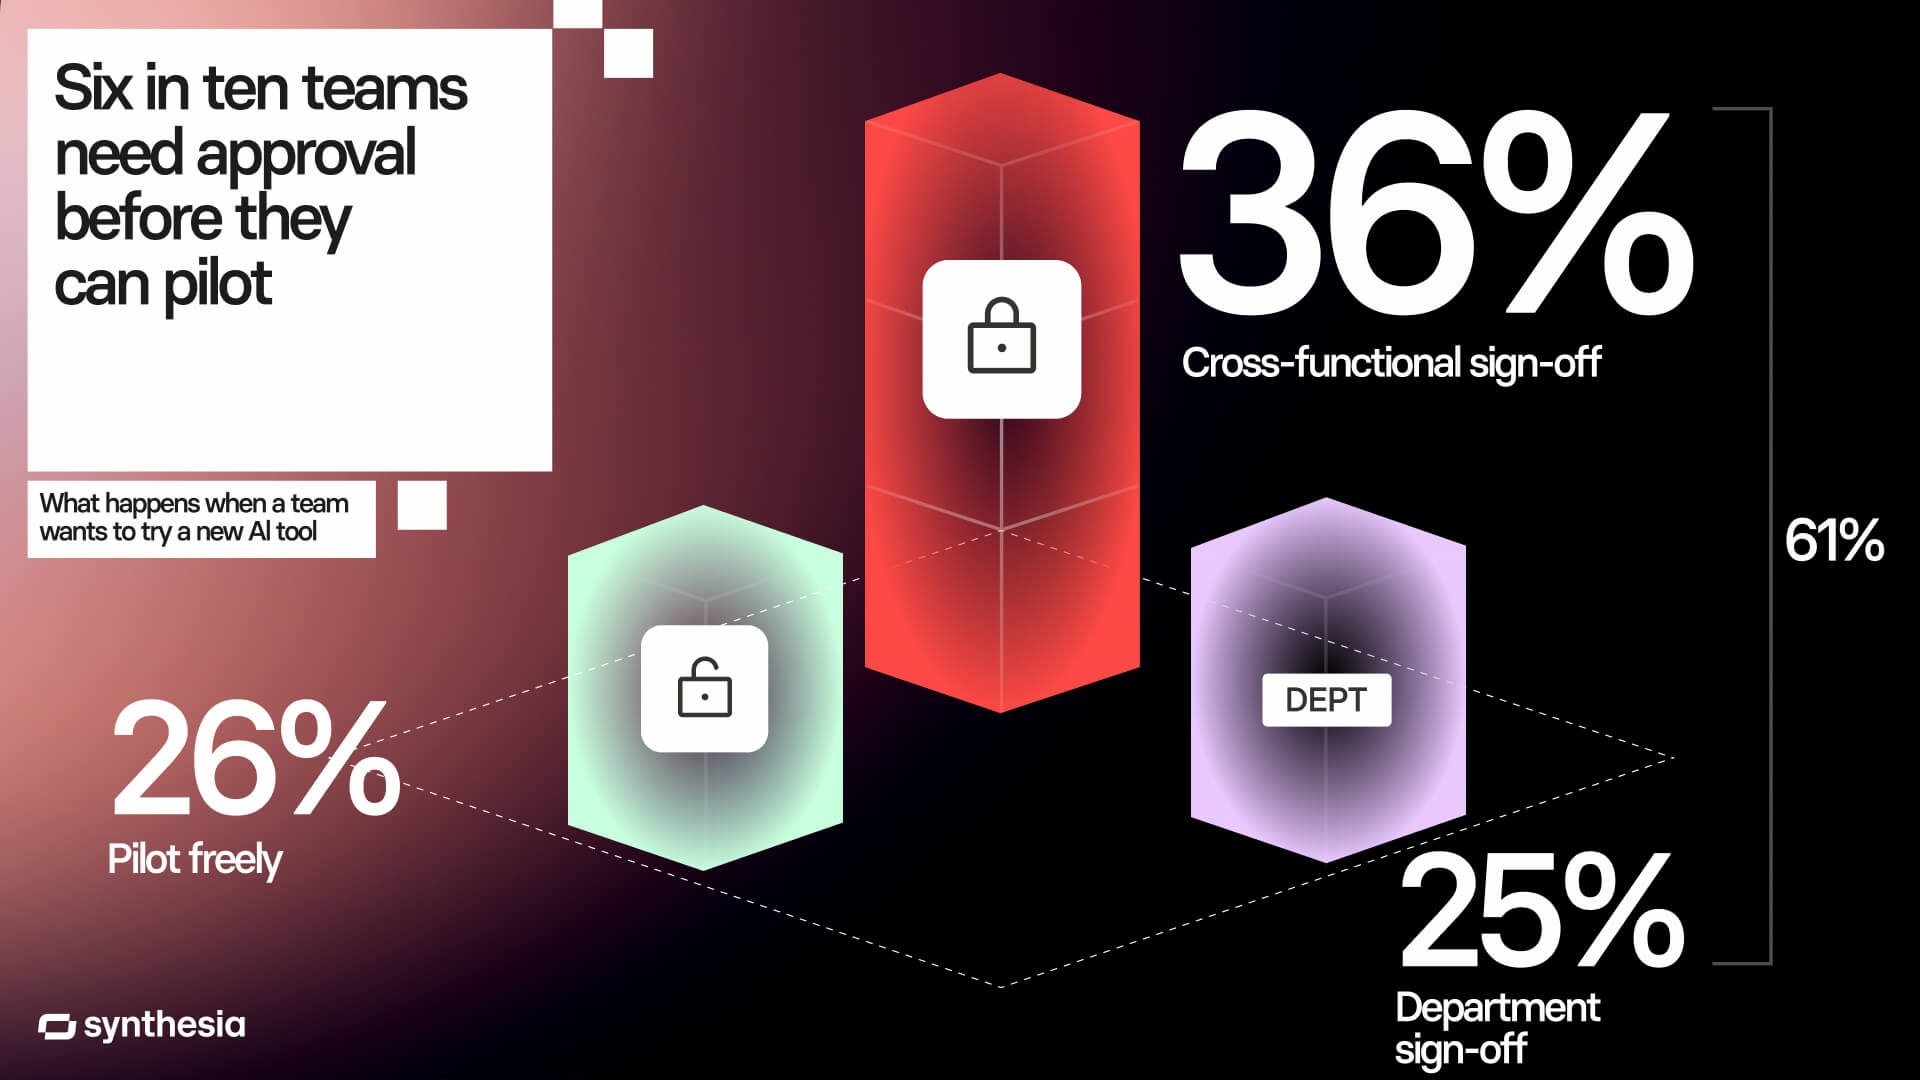
An AI mandate isn’t a green light for new tools.
Most teams (61%) need some form of sign-off before they can pilot a new AI tool, whether from their department (25%) or a cross-functional team (36%). That rises to 73% for teams that started from a leadership mandate.
How respondents describe their approval process
“We can only use company-approved AI tools, so we’re not allowed to test AI tools outside of the company.”
- An L&D professional at a midsize technology company
“If the AI tool is within our tools, like our authoring tool, then we pilot it. If it is an external tool, then we have to get approval before piloting.”
- An L&D manager at an enterprise energy company
“Not formal approval as such, but discussed with the team to consider the pros and cons of the suggested AI tool, and whether there are better alternatives, before piloting.”
- A professional at a small consulting firm
Barriers
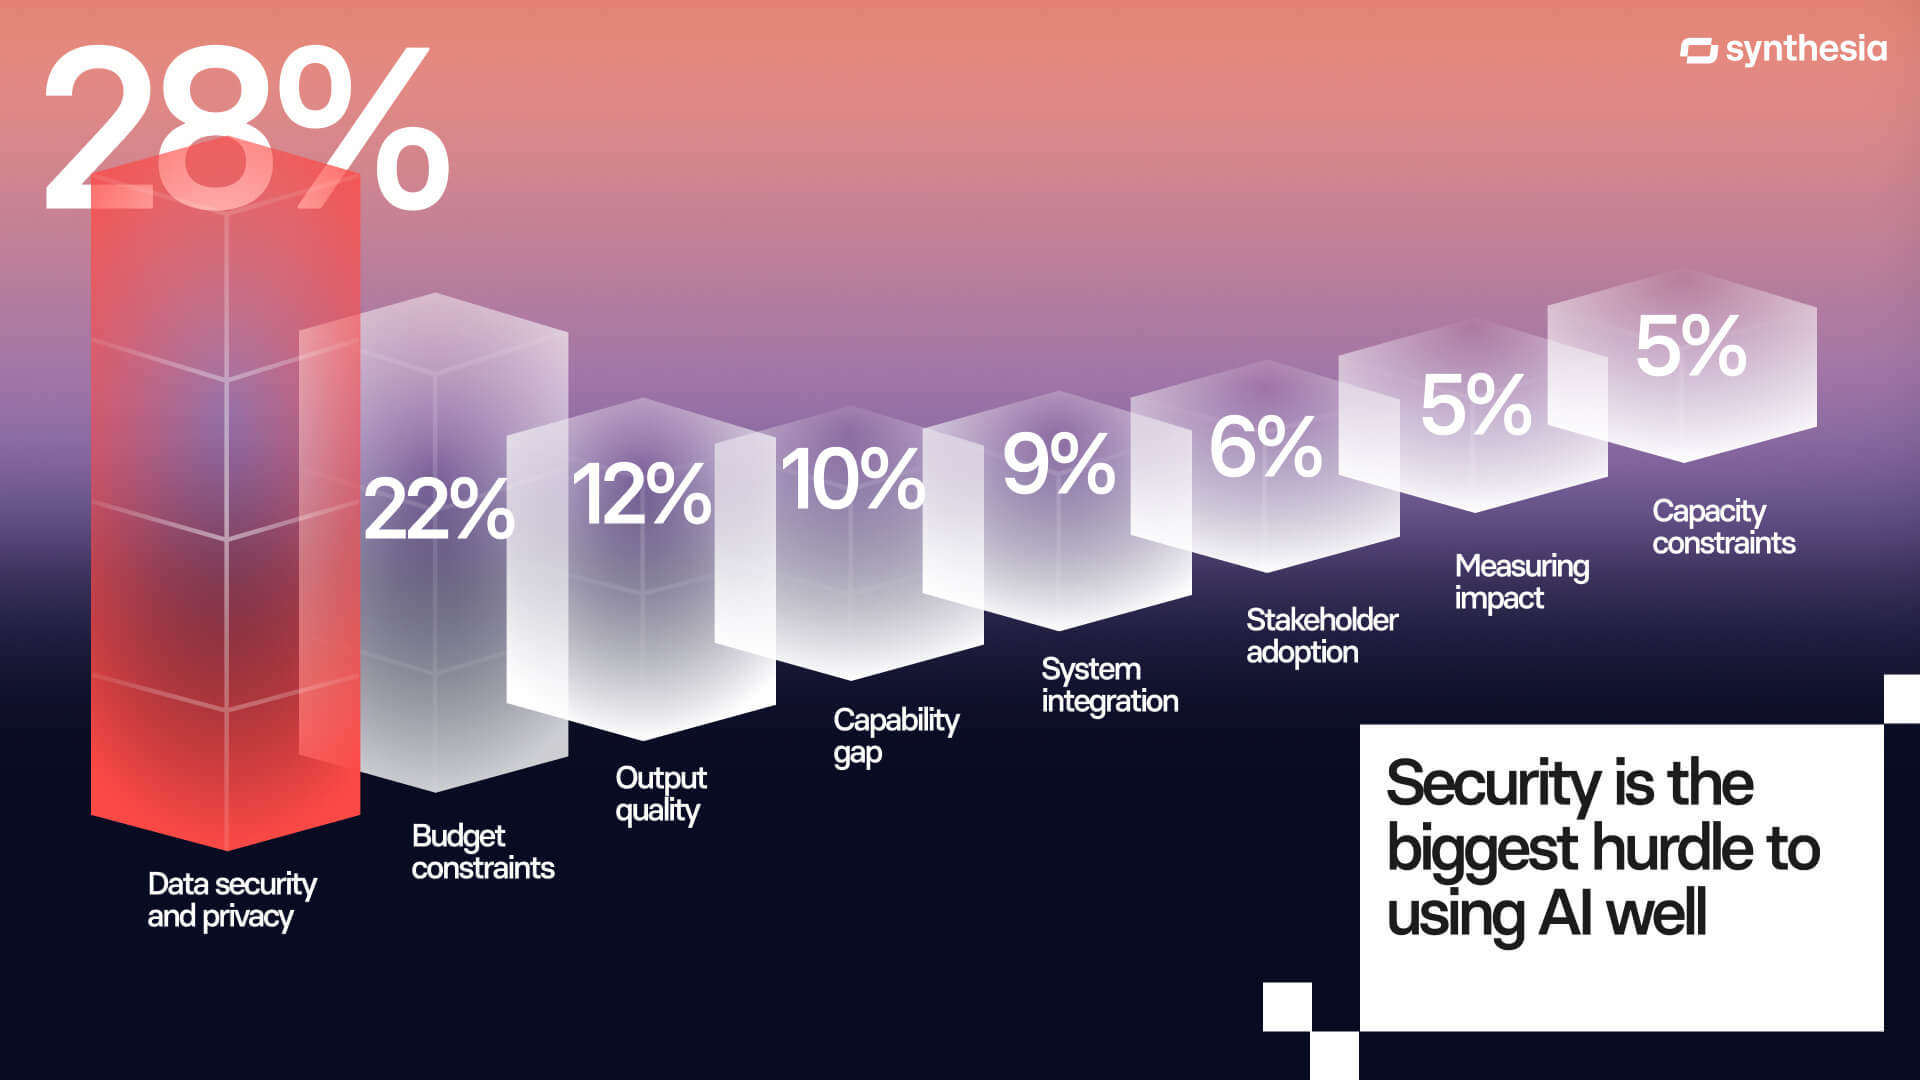
Cost is a barrier to AI adoption, but also a deciding factor.
Security and budget are what most often stand in the way of AI. Data security and privacy is the biggest barrier for 28% of respondents and budget for 22%, together about half, while output quality (12%) and system integration (9%) rank well behind.
“Budget constraints, specifically around the cost associated with usage and tokens, not necessarily the tool itself. It’s hard to measure something that feels so unclear.”
- An L&D manager at an enterprise financial services company
Cost shows up again when teams are choosing AI tools, with cost and value (59%) ranking above output quality (52%), ease of use (45%), and security and privacy (40%). More than half of respondents at every company size and in every role identify cost as a primary decision factor (66% of L&D leaders and managers).
When choosing AI solutions, teams focus more on what they will cost than on how they will support their measurement needs.
Expectations
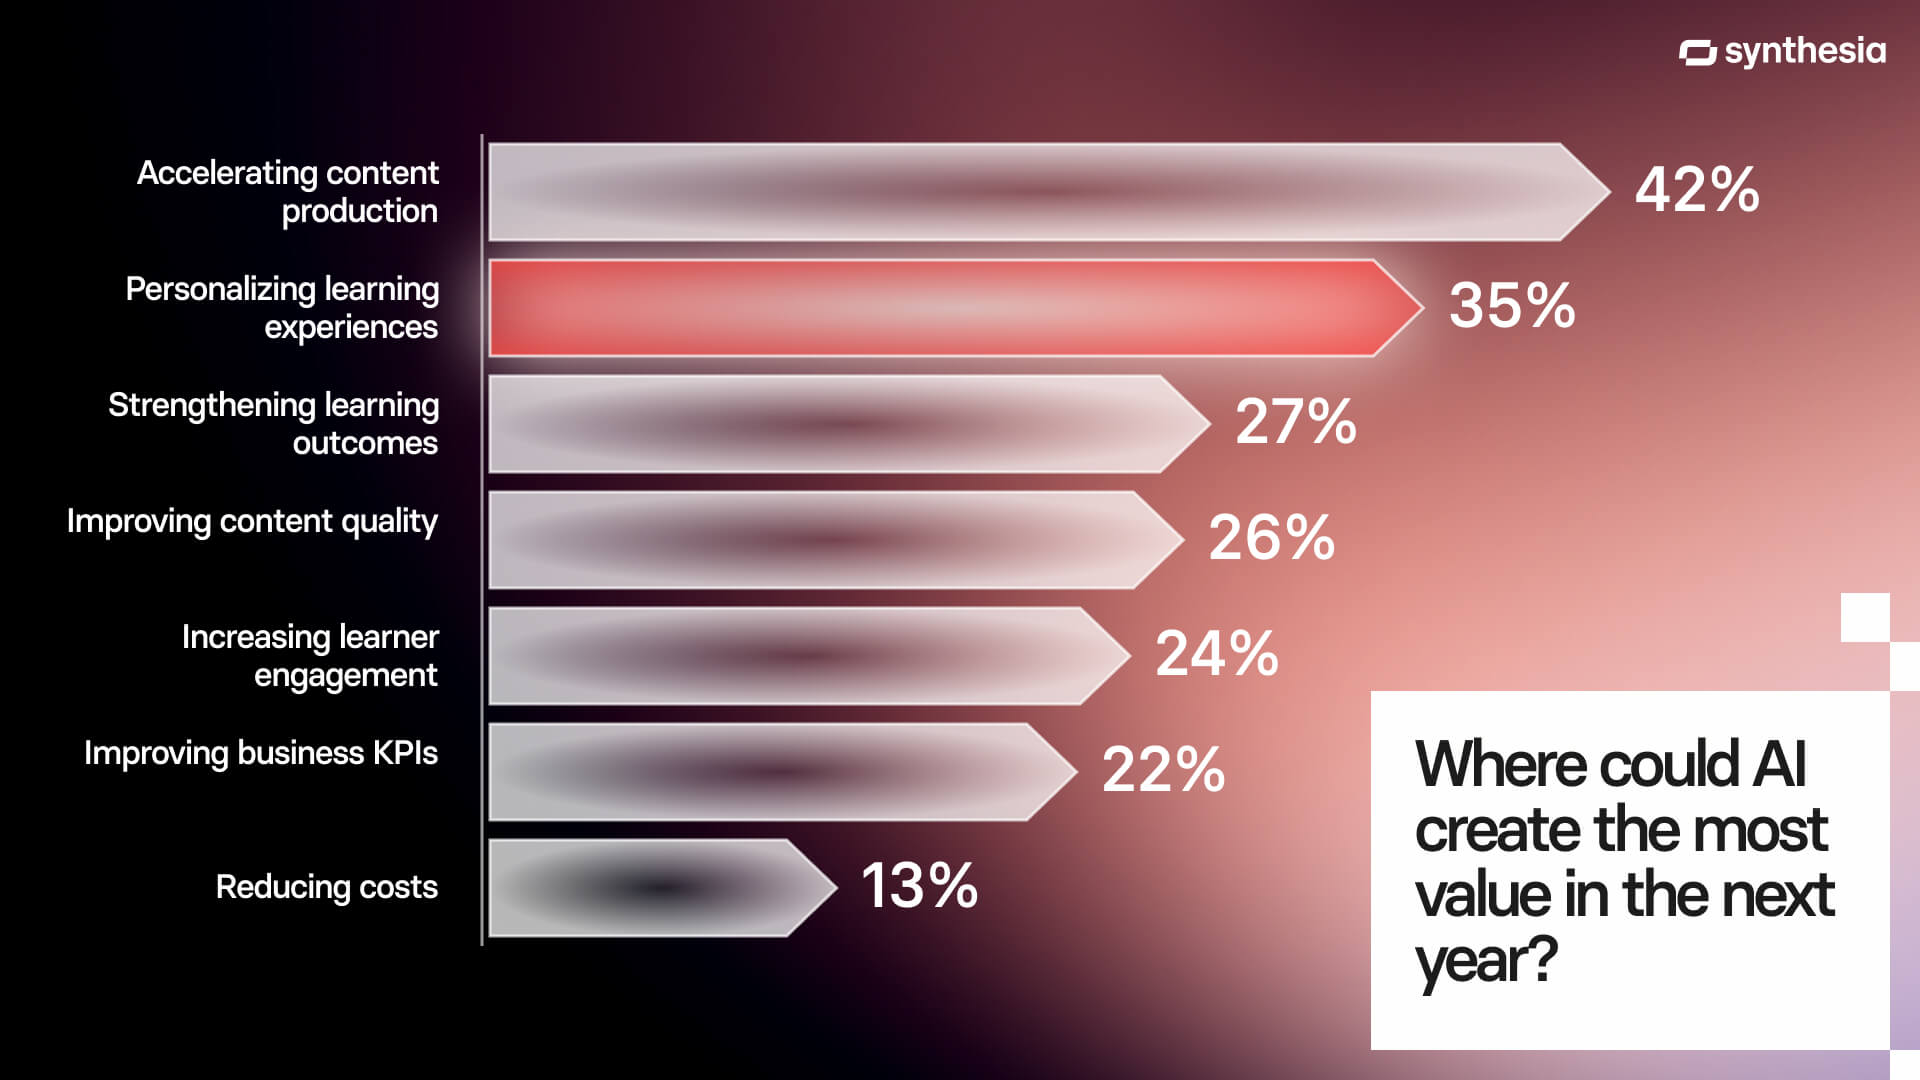
Teams expect to spend more on AI, but nearly half can’t say what they spend today.
Teams expect AI to create the most value by producing content faster. 42% of respondents say so, in line with where 75% have seen the clearest impact so far.
Personalization is still an area where teams expect AI to pay off. 35% of respondents expect AI to create the most value by personalizing learning experiences, even though only 29% use it for personalized guidance or tutoring today, well short of the 70% who forecast they would be using it by now.
Spend Visibility
56% of respondents expect AI-related L&D spend to rise over the next 12 months, and budget is already one of the biggest barriers to using AI. Yet 46% weren’t sure what share of their L&D spend is on AI, and among those who weren’t sure, 45% still expect it to rise.
Teams need to know what they’re investing in AI to weigh its cost against its perceived value.
“Approximately what % of your L&D spend goes to AI tools today?” and “In the next 12 months, do you expect AI-related L&D spend to…”
Respondents who answered the optional spend questions (n=557 for share of spend, and n=542 for expected change).
Learning Lifecycle
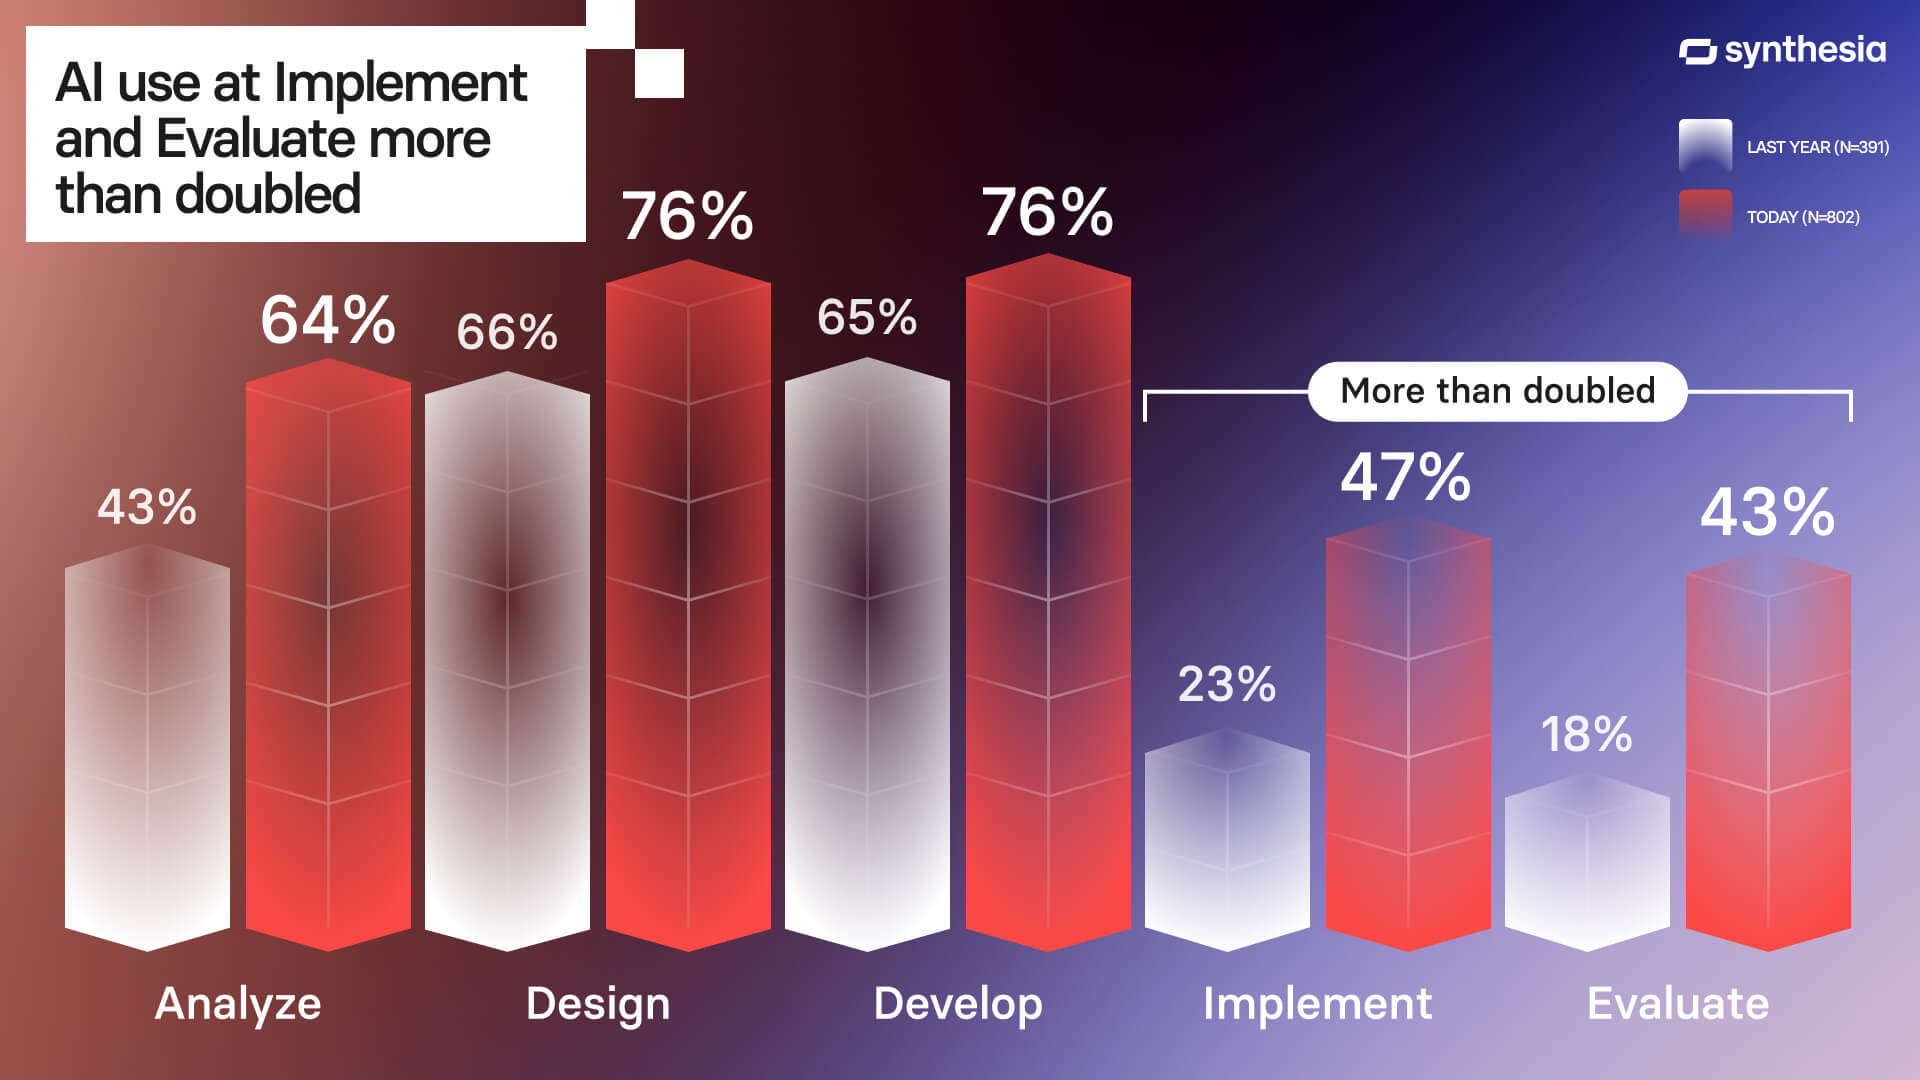
AI is being used to evaluate learning experiences, but that evaluation is limited in scope.
Last year, a majority of respondents used AI to design and develop learning experiences (66% and 65%), which aligns with content development being a primary use case. This year, the share of respondents using AI to implement and evaluate learning experiences more than doubled (47% and 43%, against 23% and 18% last year).
This suggests progress, but it should be read cautiously. Among the 252 respondents who use AI at the evaluation stage and answered our impact questions, the outcomes they most often measure are participation (72%) and learner satisfaction (70%), while only 40% consistently measure on-the-job performance and 29% measure time to proficiency.

"Completion rates tell us people showed up. AI can help us find out whether they got better, and that’s the number our leaders actually care about."
- Cheryl Yuran, Chief Human Resources Officer at Absorb Software
“Right now we track production time, output volume, and LMS completion and feedback. Next, we want to link training to operational results. Closing the gap between ‘faster’ and ‘proven impact’ is our next step.”
- A learning experience designer at a midsize company
Measurement
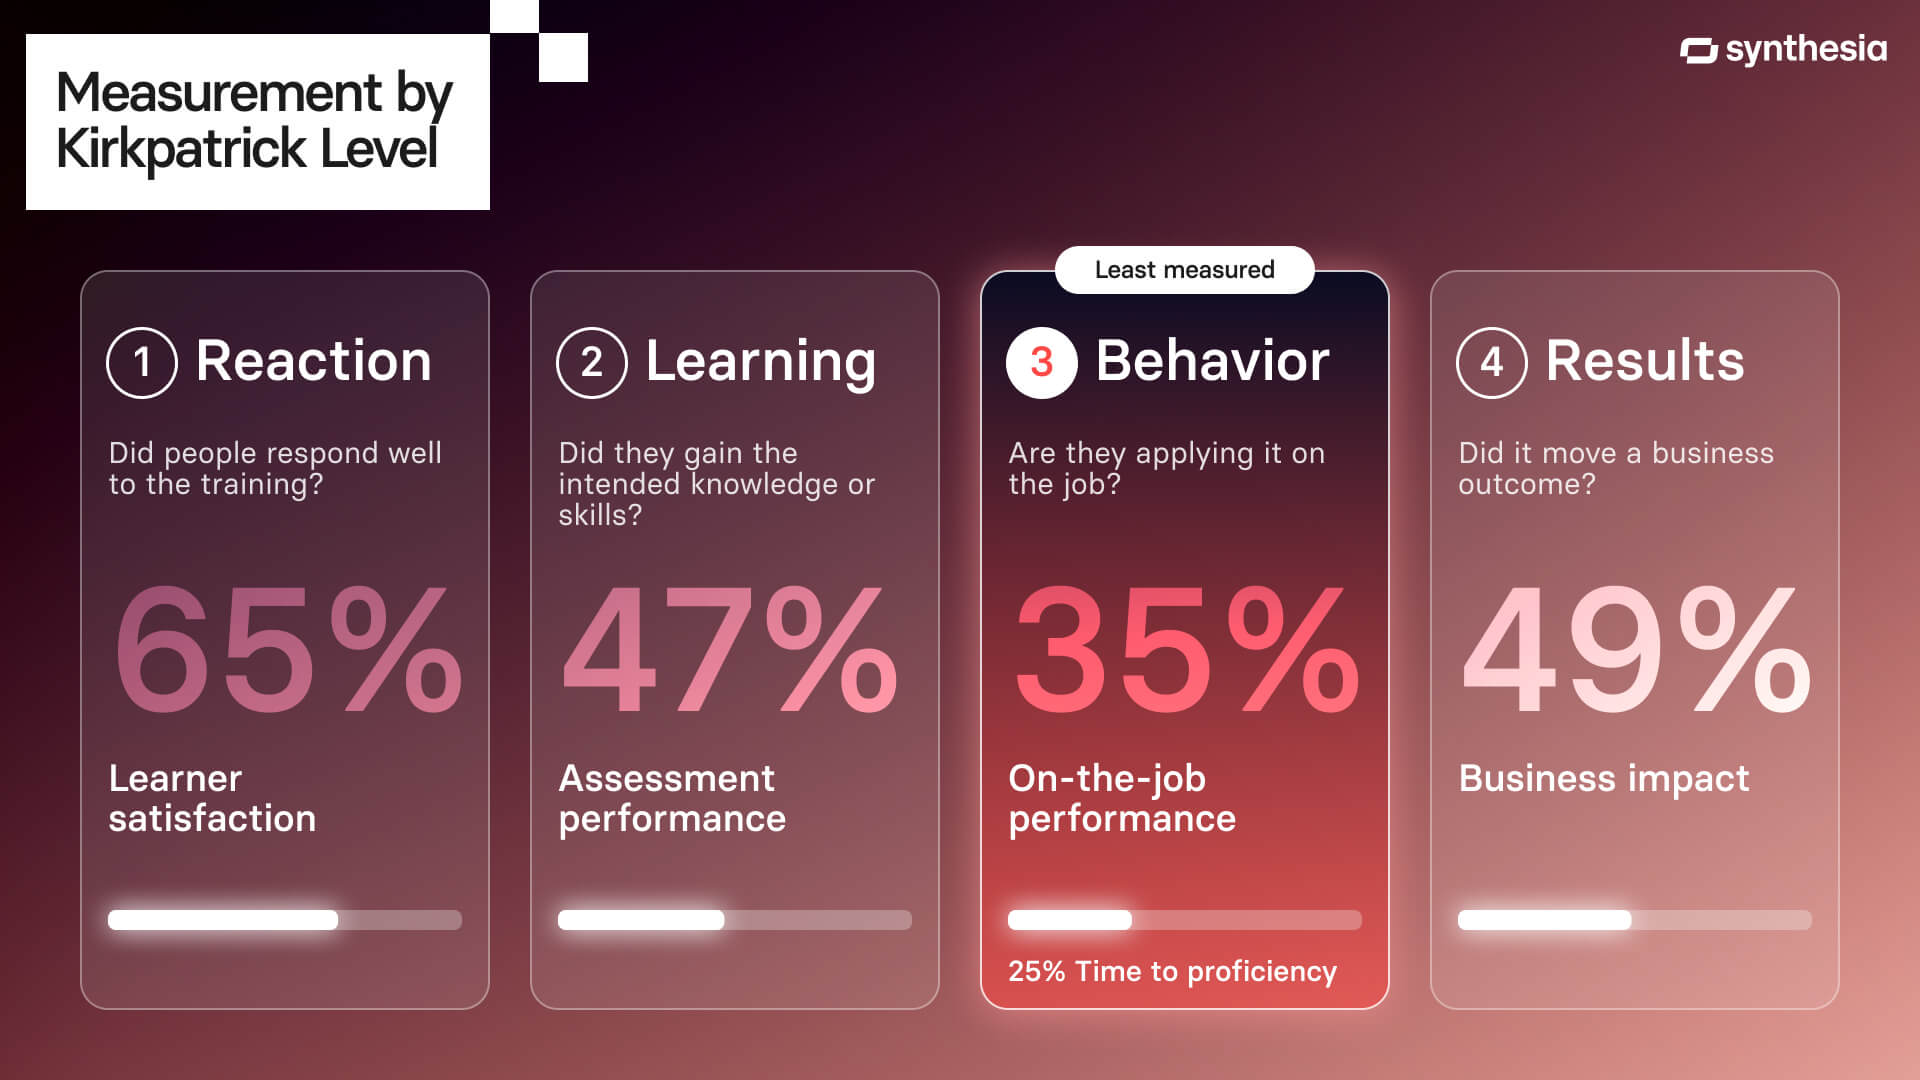
When teams say AI is behind their gains, they mostly mean speed.
In last year’s survey, 63% of respondents said they needed help assessing the impact of AI, and 23% named difficulty proving ROI as a blocker to using it. So this year we followed up with optional questions on the impact teams see from AI and how they measure it. When asked, “Where have you seen the clearest impact from AI in L&D so far?” (up to three selections), 92% of respondents named at least one area.
Efficiency gains (faster content creation, faster localization and translation, and lower cost per learning asset) made up 58% of all selections. Faster content creation was the top choice (75%), followed well behind by higher learner engagement or satisfaction (31%) and faster localization and translation (29%). Respondents named improved retention (4%), improved on-the-job performance (11%), and improved assessment performance (12%) least often.

"Working faster is a trap if speed is the only thing you can show. When speed is the only result a team can point to, the business hears that you can do more with less."
- Kevin Alster, Strategic Advisor at Synthesia
While most teams can point to gains from AI, they’re still struggling to provide evidence of those gains, in part because they lack the time and agreed success metrics to do so.
When asked, “How confident are you these improvements are attributable to AI?” 60% of respondents who named an impact are confident (38%) or very confident (22%), and the share is the same whether they named only efficiency gains (60%) or also named outcomes (59%).
Among respondents who answered the optional impact questions, we mapped the outcomes they measure to the Kirkpatrick Model, which evaluates training at four levels: reaction, learning, behavior, and results. The most consistently measured are participation and completions (72%) and learner satisfaction (65%). Behavior on the job is measured least (35% consistently measure on-the-job performance, and 25% time to proficiency), and confidence doesn’t change that: confident respondents measure on-the-job performance at the same rate as the rest (35% compared to 37%).
When we asked, “What is the biggest barrier to proving impact from AI in L&D?” 53% pointed to an organizational constraint, such as a lack of agreed success metrics (22%), access to data or measurement tools (17%), and stakeholder alignment (14%). Another 43% identified resource constraints, like time and capacity (20%) and measurement capability (12%), or unclear attribution (11%). One respondent described learning data spread across an LMS, HRIS, survey tools, and content platforms that don’t integrate, making it hard to measure the training, let alone isolate AI’s effect.
The Work Ahead
One constraint that comes up in nearly every conversation we have about L&D and AI is capacity. Over half of the respondents to this survey are on teams of five people or fewer, and 17% are on one-person teams.
“The biggest impact has not simply been that I can create content faster. It has shifted my role from primarily producing content to spending more time on learning strategy, performance needs, quality, accessibility, and whether the learning solution actually solves the business problem.”
- An L&D leader at an enterprise public-sector organization
One way to make the most of AI is to intentionally dedicate the time it saves to the work ahead. Since headcount is unlikely to be what changes, your priorities for AI should be organizational: better performance data, visibility into AI spend, and alignment on success metrics for your experiments. The full report shows where your team stands and what to do next.

FAQs
What percentage of L&D teams use AI?
In Synthesia’s survey of 831 L&D practitioners, 73% said their team uses AI in specific workflows (36%) or widely across its work (37%). Another 24% were still exploring or piloting it, 2% were not using AI, and 1% said adoption had stalled. Respondents likely skew toward early adopters of AI, so adoption here likely overstates the wider L&D population.
What are L&D teams using AI for?
L&D teams are using AI to generate content, create videos, analyze data, build assessments, automate admin work, translate and localize training, run roleplays and simulations, personalize guidance, map skills, and support coaching.
What is the biggest impact of AI in L&D so far?
AI’s clearest impact in L&D so far is speed. Teams are realizing efficiency gains by using AI to create and localize training faster.
Are L&D teams using AI to personalize learning?
While some L&D teams are using AI to personalize learning, most are not. Only 29% of respondents to our annual AI in L&D survey said they were using AI for personalized guidance or tutoring. Nonetheless, 35% expect personalized learning to create the most value from AI next year.
What are the biggest barriers to L&D teams using AI?
Data security and privacy and budget are the biggest barriers to L&D teams using AI, followed by output quality and system integration. Teams also often need cross-functional or departmental approval before they can pilot a new AI tool.
How much do L&D teams spend on AI?
Many L&D teams aren’t sure how much they’re spending on AI, yet more than half expect that spend to rise over the next 12 months. Reasons for this lack of visibility may include distributed budget ownership, such as AI tools being owned by IT or another corporate function, or teams being unsure how to calculate the cost of using AI. Without that visibility, teams can’t see how each AI tool affects cost per learner, which makes budgeting and ROI conversations harder.
How do L&D teams measure the impact of AI?
According to our 2027 AI in L&D survey, L&D teams most consistently measure activity, like participation and completions (72%), followed by learner satisfaction (65%). Fewer consistently measure on-the-job performance (35%) or time to proficiency (25%). Yet 60% of respondents who named an impact are confident the improvements they see are attributable to AI.
Why is it hard to prove the ROI of AI in L&D?
The biggest barriers to proving the impact of AI in L&D are mostly organizational, including a lack of agreed-upon success metrics, limited access to data or measurement tools, and stakeholder alignment. Others include resource constraints, like time, capacity, and measurement capability, and unclear attribution.
What do L&D teams that report performance gains from AI adoption have in common?
Teams that report performance gains from AI tend to be able to pilot new tools without cross-functional approval, use AI widely across their work, build or experiment with their own AI tools, and use AI to evaluate training.
How was the AI in L&D survey conducted?
Synthesia’s 2027 AI in Learning & Development survey collected responses from 831 L&D practitioners between September 15 and October 9, 2026. 58% are L&D leaders, managers, or designers, and 56% work at organizations with more than 1,000 employees. Respondents likely skew toward early adopters of AI, so adoption here likely overstates the wider L&D population.